DWELLING CONSTRUCTION AND PRICES


HOUSING PRICES
The housing prices indicator [1] shows indices of residential property prices over time. Included are rent prices, real and nominal house prices, and ratios of price to rent and price to income; the main elements of housing costs.
In most cases, the nominal house price covers the sale of newly-built and existing dwellings, following the recommendations from RPPI (Residential Property Prices Indices) manual.
The real house price is given by the ratio of nominal price to the consumers’ expenditure deflator in each country, both seasonally adjusted, from the OECD national accounts database.
The price to income ratio is the nominal house price divided by the nominal disposable income per head and can be considered as a measure of affordability.
The price to rent ratio is the nominal house price divided by the rent price and can be considered as a measure of the profitability of house ownership. This indicator is an index with base year 2015.

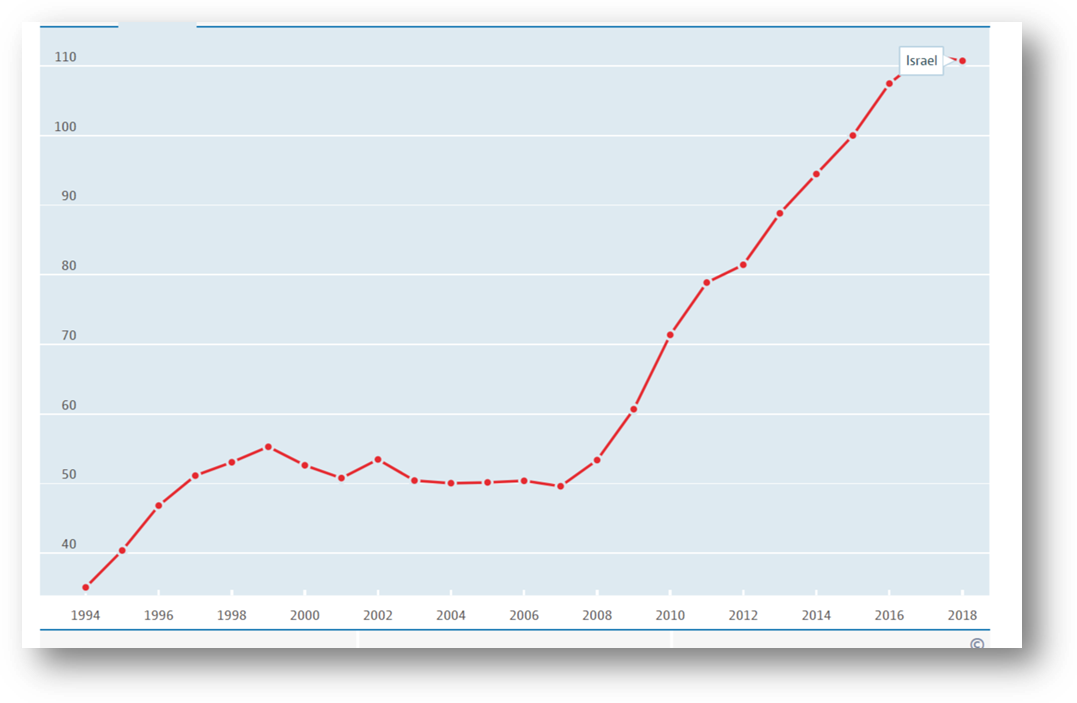
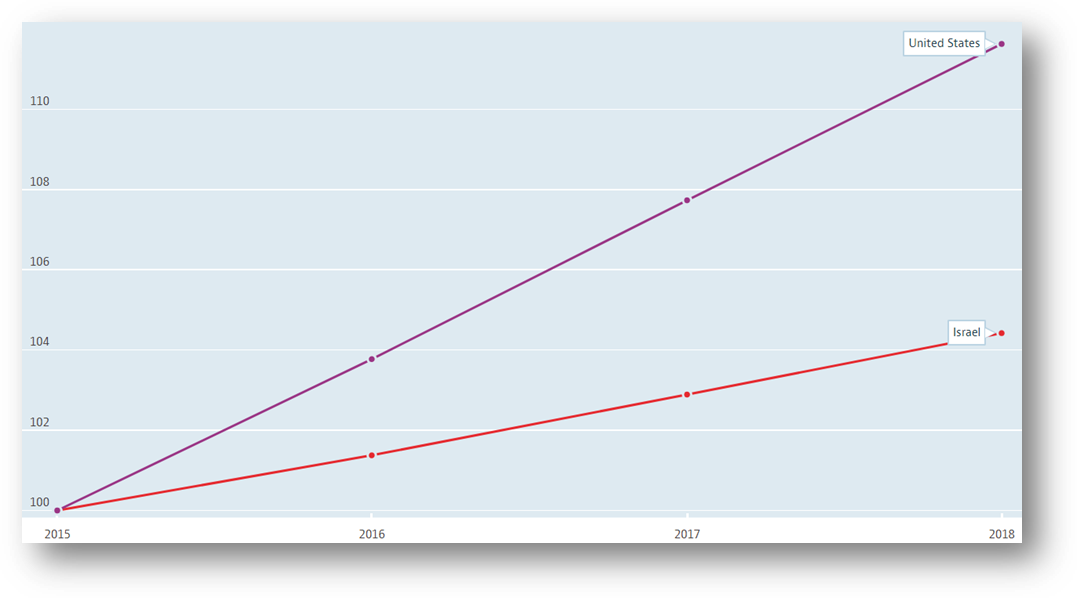
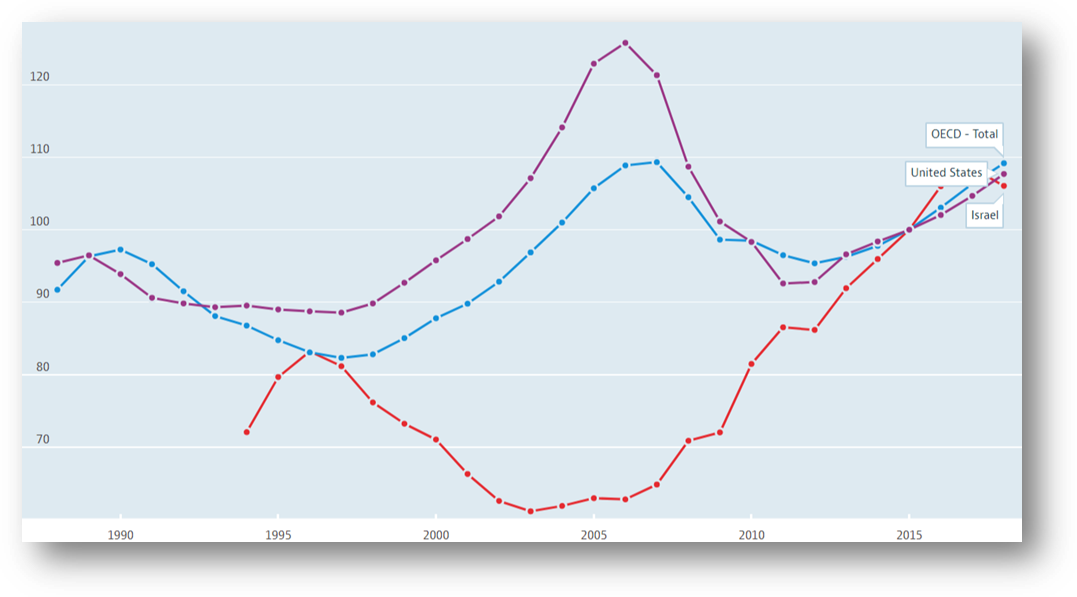
NOMINAL HOUSE PRICES

Zoom-in on the last 3 years ->

HOUSING PRICES
Nominal house prices, 2015=100, 1994 – 2018 [2]
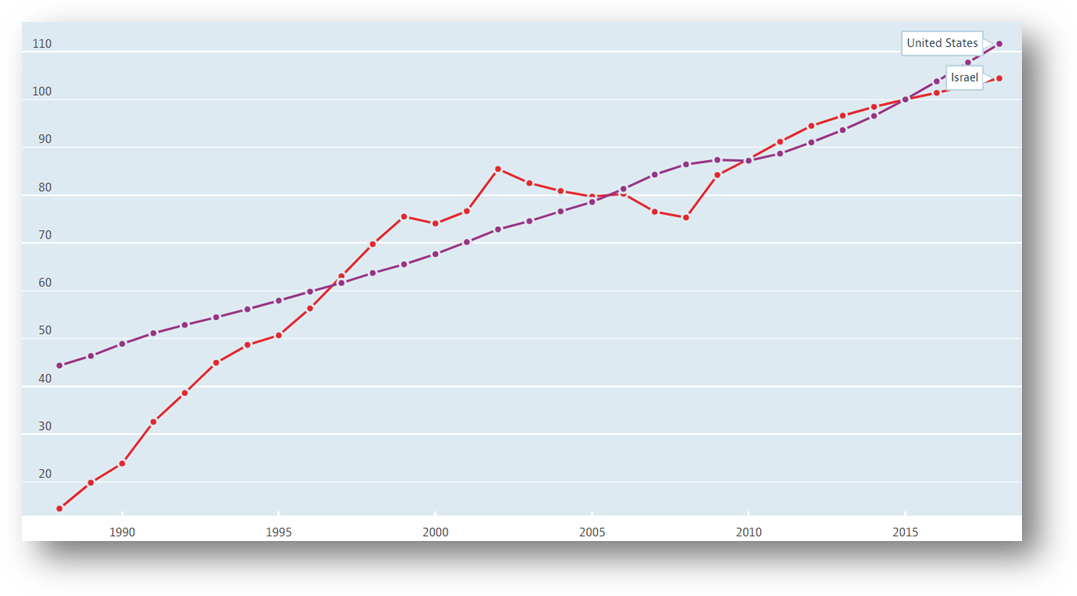
Real house Price – global comparison –

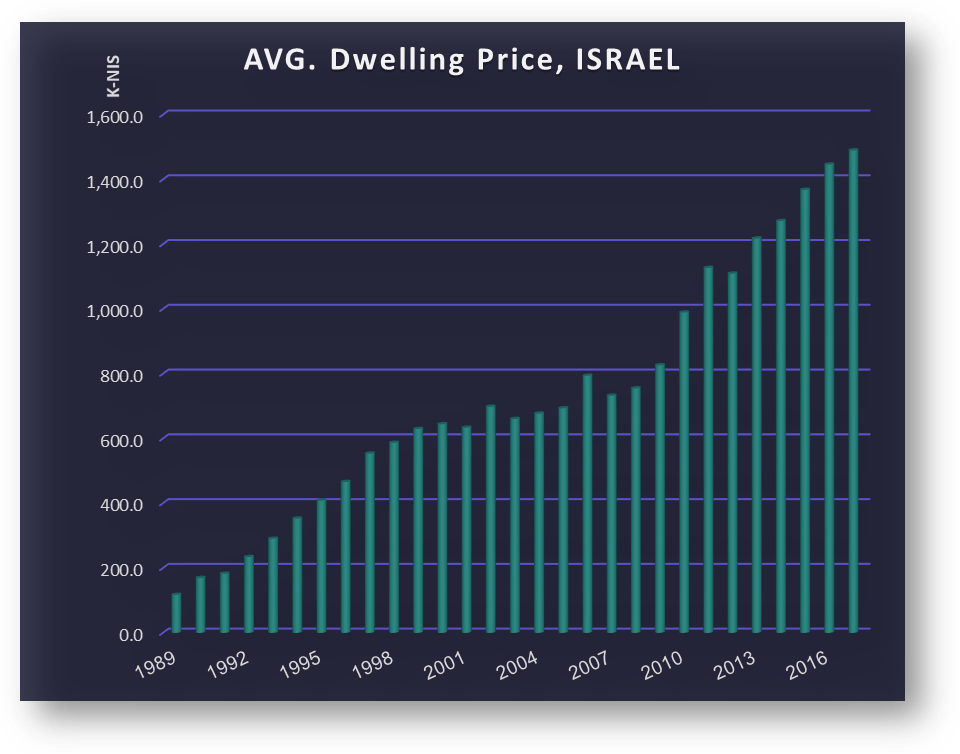
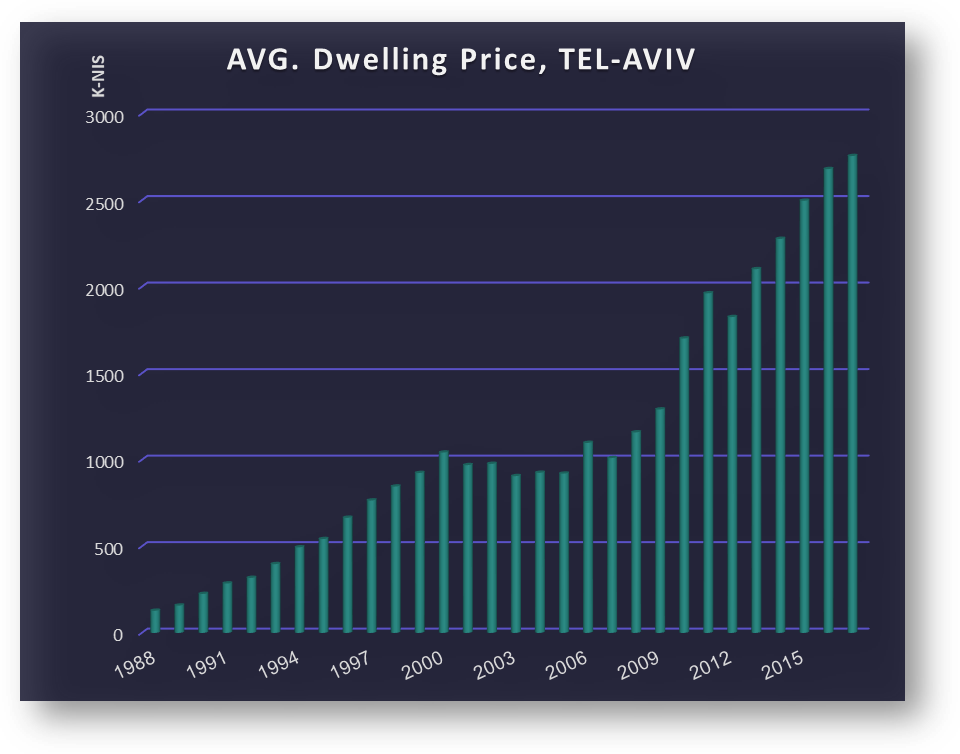
AVERAGE DWELLING PRICE IN MAIN DISTRICTS


RENT PRICE
Zoom-in on the last 3 years ->
AVERAGE RENTAL PRICE IN MAIN DISTRICTS


PRICE TO RENT RATIO
Zoom-in on the last 3 years ->

NOMINAL HOUSE PRICES / RENT PRICE
(2015=100), Y:2018 OECD

PRICE TO INCOME RATIO
A comparison chart ->

And that same index, showing only Israel ->

Depicted below is OECD comparison chart based on a survey from 2018 [3]

[1] https://data.oecd.org/price/housing-prices.htm
[2] https://data.oecd.org/price/housing-prices.htm
[3] http://www.oecd.org/economy/surveys/…